Let’s talk about Teoscar Hernandez‘s second half last year. For all the flak the guy takes for his fielding, he deserves some praise for turning things around at the plate in July. In this age of swing adjustments and launch angle, we must be careful with small sample sizes and try to ascertain which stats, if any, are meaningful.
A back-and-forth on Twitter about Teoscar between Mike Kurland and I led to the following response, which is sure to catch the eyes of Jays fans.
I feel he’s one adjustment away from a Soler-ish breakout.
— Mike Kurland (@Mike_Kurland) February 1, 2020
For reference, Jorge Soler posted a .265/.354/.569 triple slash line last year and swatted 48 home runs, which led the American League. I don’t think Mike’s saying we should expect Hernandez to flirt with 50 homers this year, but it’s easy to see the similarities.
Soler, long-blessed with plus raw power, wasn’t able to tap into it enough to offset the substantial swing and miss in his game. That is until 2019. Hernandez also has a case of whiff-itis that probably isn’t going anywhere. But he also draws walks. And he has the exit velocity to easily improve upon his career high of 26 home runs.
We caught a glimpse of that in July, as Teoscar looked like a completely different hitter than he did in the season’s first half.
| Teoscar Hernandez Season Splits, 2019 | ||||||||
|---|---|---|---|---|---|---|---|---|
| PA | AVG | OBP | SLG | BB% | K% | GB% | wRC+ | |
| 1st Half | 236 | .204 | .267 | .361 | 8.1% | 30.1% | 41.4% | 63 |
| 2nd Half | 228 | .259 | .346 | .592 | 11.4% | 36.0% | 36.1% | 142 |
| Source: FanGraphs | ||||||||
The only area where he got worse was strikeout rate. Interestingly, his contact rate actually rose in the second half from 68.4% to 69.4% and he chased fewer pitches out of the zone, going from 32.3% to 28.2%. So make of the K rate what you will. Even with the strikeouts his production was vastly superior to that in his first half.
The improvement is easier to see when shown in 30-game rolling averages:
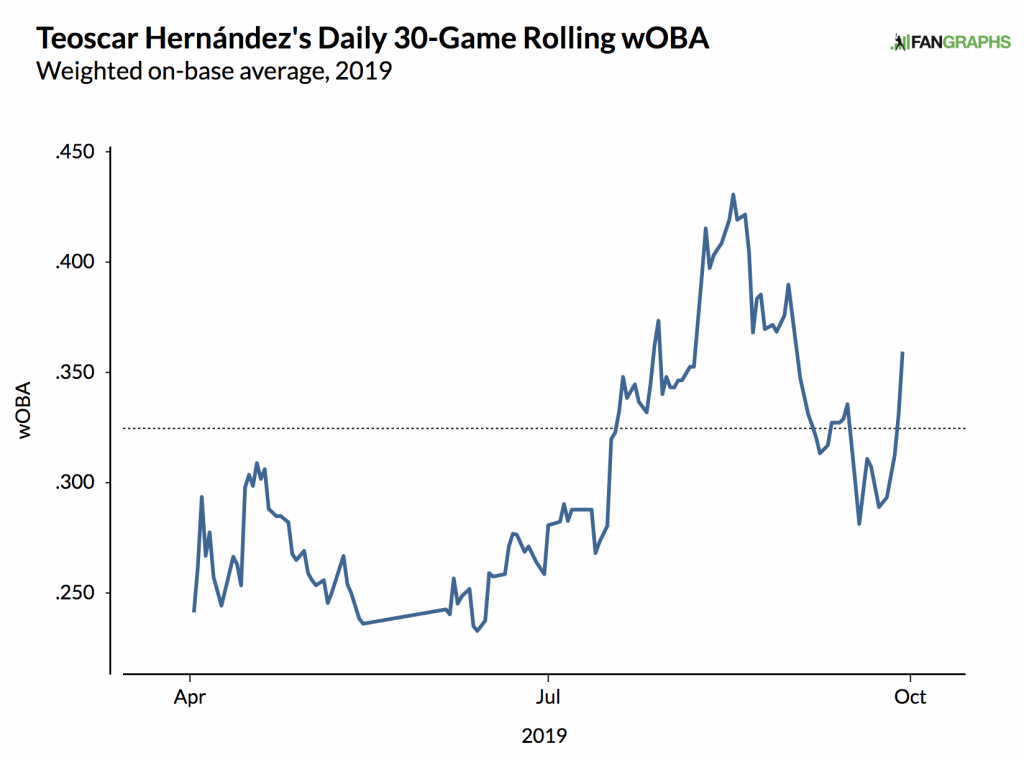
Sometimes there’s nowhere to go but up.
Statcast Says…
Like Soler, Hernandez hits the ball hard. His average exit velocity in 2019 ranked in the top 15% of the league. In the season’s second half it was especially high, ranking in the top 1%.
That’s impressive, but how much does a half season of data really say about the quality of the hitter? The urge to cherry-pick positive numbers and forget about a first half dumpster fire is strong.
So let’s look at the very best average exit velocities in 2018’s second half and see how the players fared in 2019 over a full season. Since we’re interested in Hernandez’s power potential, we’ll focus on isolated power (ISO).
| Average Exit Velocity in 2018 second half vs. ISO in full season 2019 | ||
|---|---|---|
| Name | '18 Avg. EV (mph) | '19 ISO (percentile rank) |
| Giancarlo Stanton | 94.0 | .203 (N/A) |
| Tommy Pham | 93.7 | .176 (45) |
| Matt Chapman | 93.6 | .257 (87) |
| Joey Gallo | 93.4 | .344 (99) |
| Nelson Cruz | 93.1 | .328 (98) |
| Ryan Braun | 92.9 | .220 (70) |
| Robinson Cano | 92.4 | .172 (41) |
| Sal Perez | 92.2 | N/A |
| Shohei Ohtani | 92.2 | .219 (69) |
| Kole Calhoun | 92.1 | .236 (78) |
| Source: FanGraphs & Baseball Savant Percentile Rank based on min. 200 PA. Stanton and Perez did not qualify due to injuries |
||
This is far from an exhaustive analysis but it looks promising for Hernandez. Except for the sad trombone noises that are Pham and Cano. The issue with them, however, is that their high ground ball rates negated power production. Overall this is a good group of sluggers.
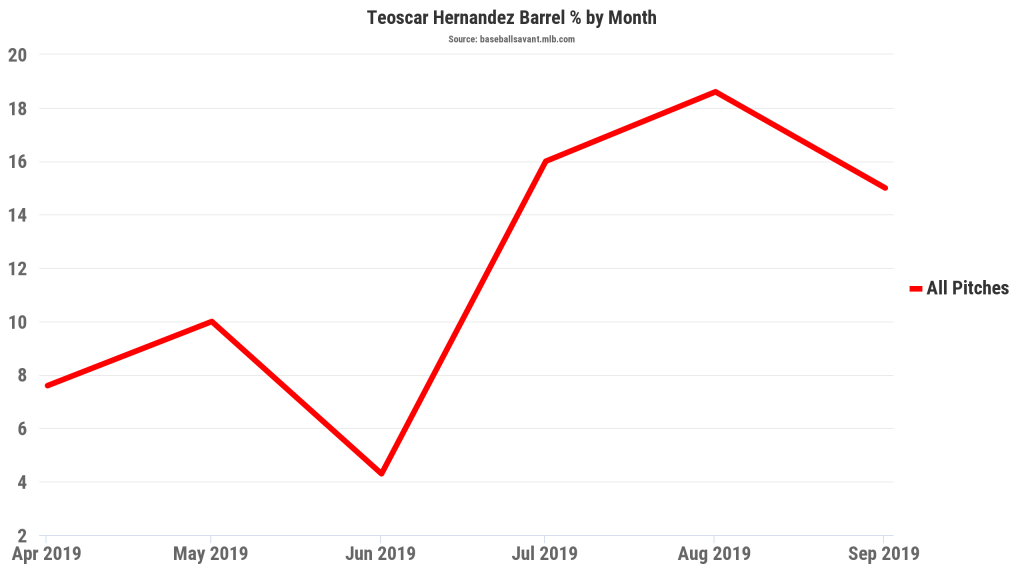
But the lesson here is that exit velocity only tells us part of the story, and a metric like Statcast’s Barrel percentage can help fill the gaps. A Barrel isn’t just defined by exit velocity, but also by launch angle. Hard contact isn’t as useful to a hitter if it’s on the ground.
Even going back a year there are good signs. In 2018, Hernandez’s 15.5% Barrel rate ranked in the top 3% of all qualified hitters. And I think that speaks volumes to what we can dream on with him as a hitter. But what about that first half in 2019?
Hernandez struggled defensively, to put it mildly. During last year’s Players Weekend I gave him the nickname “Born To DH”. Ok, that was a bit unfair. And it probably didn’t help that he was adjusting to new outfield positioning under manager Charlie Montoyo. And about that – what the hell were the Jays doing?
No other team shaded their left fielders towards centre as much as the Jays did last year.
Red dots, left to right: Gurriel, McKinney, Drury, Hernandez, Alford, Fisher.
Any theories as to why they were such an outlier? pic.twitter.com/OkxuuV5oTJ
— John Metzler (@bluejaysbeat) January 9, 2020
I’ll go out on a limb and say the Jays weren’t outsmarting the rest of baseball, especially considering the defensive metrics for their left fielders were all dog doo-doo. Maybe Hernandez was taking his fielding issues to the plate more than we realized, because when he transitioned to centre field after his May demotion to Buffalo, it wasn’t long before he A) actually seemed less bad in the field and B) started mashing at the plate.
Once he got back on track midseason, the high quality of contact returned.
Like most stats, Barrel% is going to fluctuate over time. So how do we know what’s “real”?
Russell A. Carleton provided some stabilization points for Statcast metrics at Baseball Prospectus in 2016. Considering it takes just 50 balls hit fair for a reliable sample, and Hernandez has hit 581 since 2018, it’s safe to say that we have enough to go on.
Sure, we can’t just wipe away his first half as if it never happened. He hit the ball poorly, period. But his percentile ranks in Barrel% over the past two full years (top 3% in 2018 and top 14% in 2019) are fairly good indicators of high-end skill.
So that’s that.
What About All Those Strikeouts?
Oh, right. Hernandez’s quality of contact might rank with some of the best in the league but his quantity of contact most certainly does not. This is the final piece to the puzzle.
Soler took this step last year in a big way. The key to this was an obvious, but difficult, thing to achieve: hitting more pitches thrown in the strike zone.
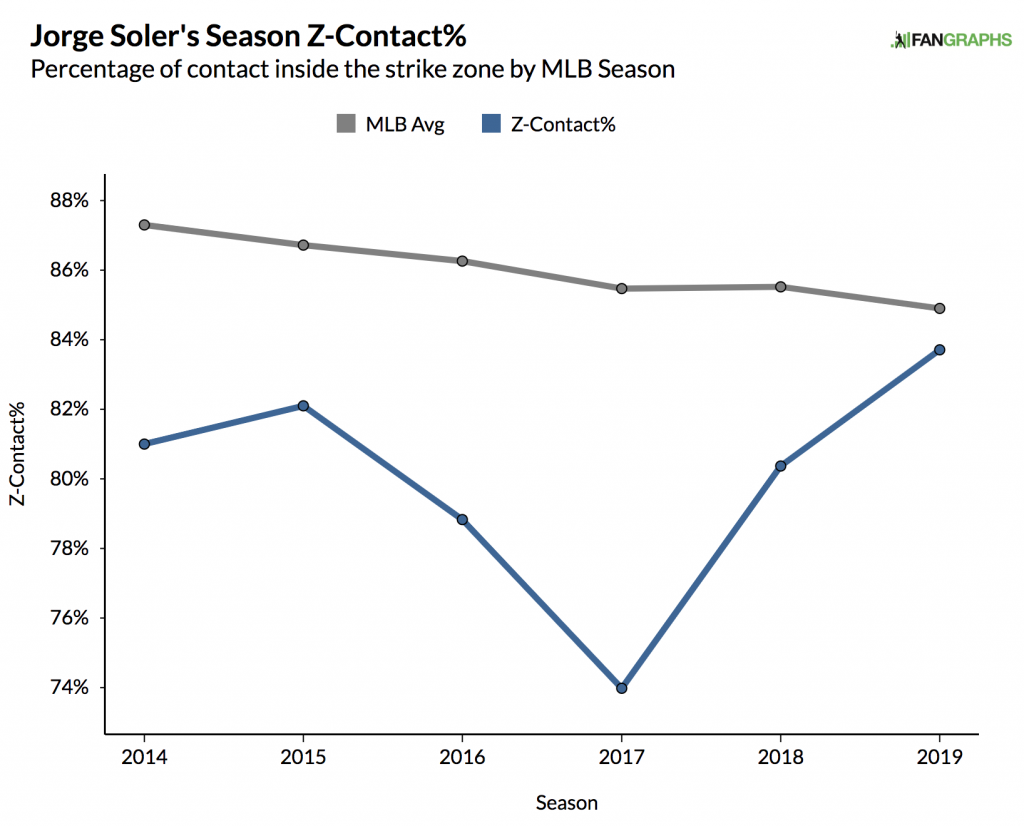
Soler was finally making pitchers pay when they worked in the zone. Breaking down his success further reveals how effective he was specifically against fastballs.
Data taken from Baseball Savant shows the huge leap forward in 2019 against heaters in the strike zone.
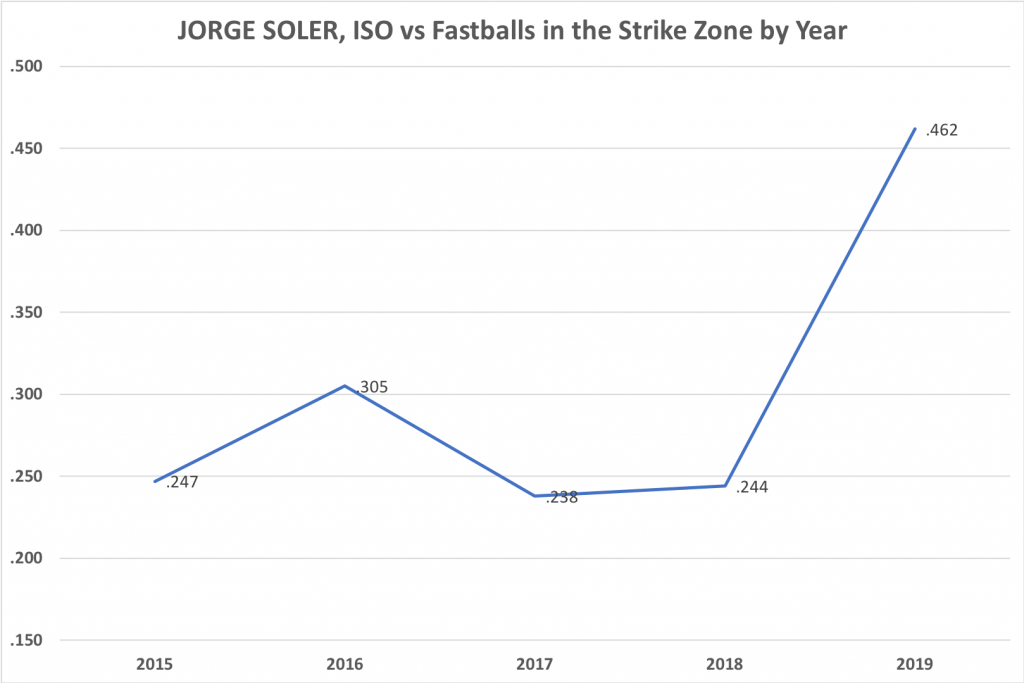
No wonder he hit 48 home runs! That Ruthian .462 ISO placed him in the 98th percentile on fastballs in the zone last year. Hernandez’s .294 ISO given the same criteria wasn’t quite as good, ranking in the 74th percentile.
Now, Teoscar doesn’t need to follow the exact same path as Soler did in order to break out. But he probably should.
According to Statcast’s pitch tracking, Hernandez saw 568 fastballs thrown in the strike zone last year, and swung and missed at 20.4% of them (or, put differently, the worst 3% of the league). Soler, on the other hand, swung and missed at a rate of just 11.7%.
Is the 20% rate a sustainable path to success? That’s unlikely. Below are the players with a higher whiff% than Teoscar on the fastball strike zone leaderboard, along with their 2019 wRC+.
Keon Broxton, 38 wRC+
Jeff Mathis, 2
Khris Davis, 81
Jason Castro, 103
Austin Riley, 86
Aristides Aquino, 119
Jorge Alfaro, 95
Joey Gallo, 144
Travis Demeritte, 65
Ryan McMahon, 88
Michael Chavis, 96
That’s mostly a lot of ‘meh’. And then there’s Jeff Mathis. Oof.
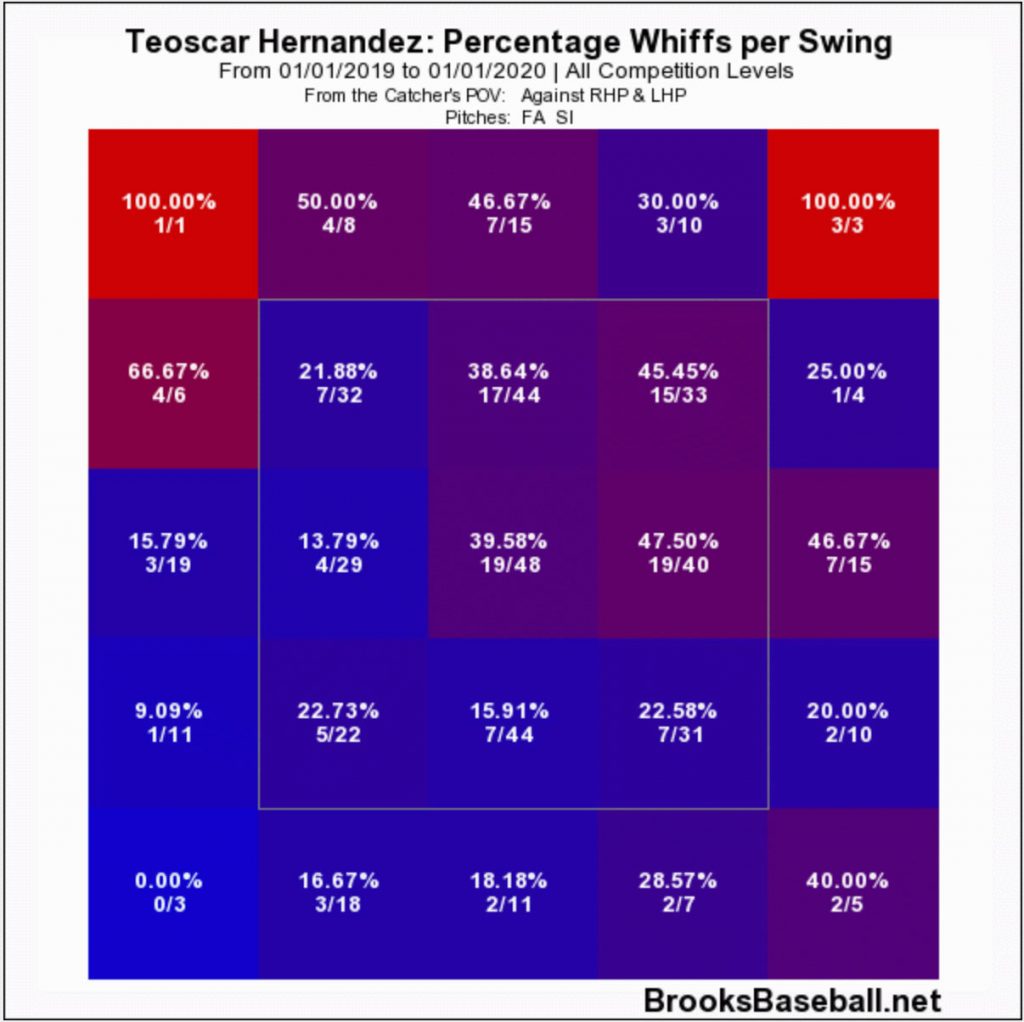
Aquino hit well, but that was in a small 56 game sample. And Gallo is just a damned unicorn. If Hernandez wants to break out in a real way, he’ll need to start doing more with fastballs over the plate. Have a look at Soler’s whiff rates broken down by location on fastballs, courtesy of Brooks Baseball.
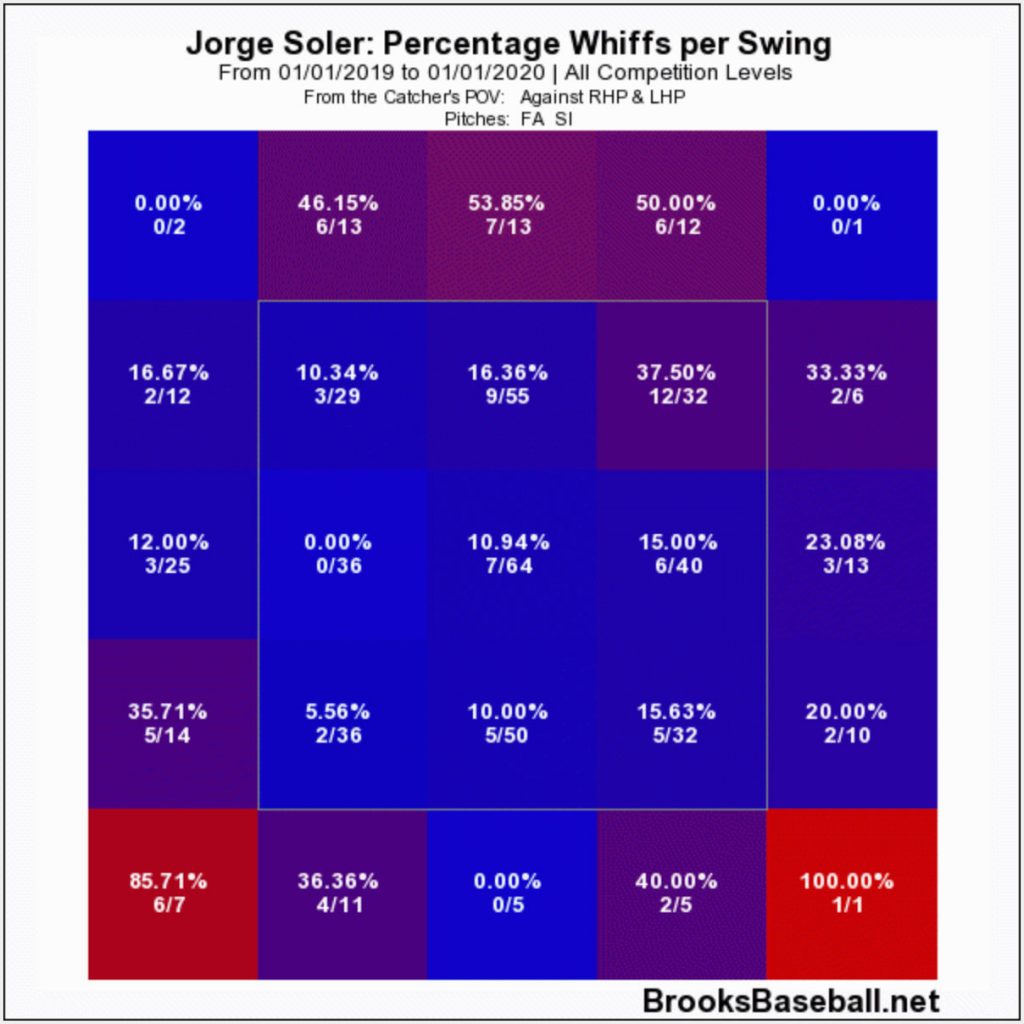
While you look at this, remember that Soler isn’t exactly Willians Astudillo. He still has some swing and miss in his game. But juxtaposed against Hernandez’s chart from last year, Soler doesn’t look half bad.
A centre-cut whiff rate of almost 40%?! Holy doodle, that seems bad. He’s better on the inside portion, but awful on fastballs away.
Hey, sometimes a pitcher just overpowers you. Like Tyler Glasnow did with some straight cheese in a game on September 8th.
And, uh, sometimes you get fooled by an 89 mph fastball from Bobby Poyner. ¯\_(ツ)_/¯
Taking a step back, the issue seems clear. Hernandez’s rate of contact on all pitches thrown for strikes was 76.8% last year, which ranks among the worst 3% in MLB. No one becomes the mayor of Dingerville by expanding the zone, so Teoscar will have to do more when he sees a hitter’s pitch.
Is he a toe tap or bat wiggle away from being Jorge Soler 2.0? Maybe we’ll get lucky and see the switch flip like it did for Jose Bautista in 2010. Ok, probably not. But in early February dreams are all we have.