Perhaps the most divisive Toronto Blue Jays player (now that Ryan Goins is gone) is Designated Hitter Kendrys Morales. He had the unenviable job of filling Edwin Encarnacion’s shoes a year ago – a losing battle for anyone. The biggest knock against him seems to be that he isn’t earning his contract, a 3-year $33 million deal with two years left. That’s not my concern with him though. I mean, it’s not my money. Instead, my concern is that he might need to make an adjustment to how pitchers are pitching to him.
Morales has been a really, really good fastball hitter. According to Statcast, since 2015 his .402 wOBA against fastballs is 33rd highest of 491 hitters (min. 150 AB), the 94th percentile rank. By slugging percentage, he sits 28th, the 95th percentile rank. That’s elite company, and the biggest reason why he’s remained an effective DH all these years.
However the key phrase is “has been”. Below are 3-year trends for some statistics against fastballs.
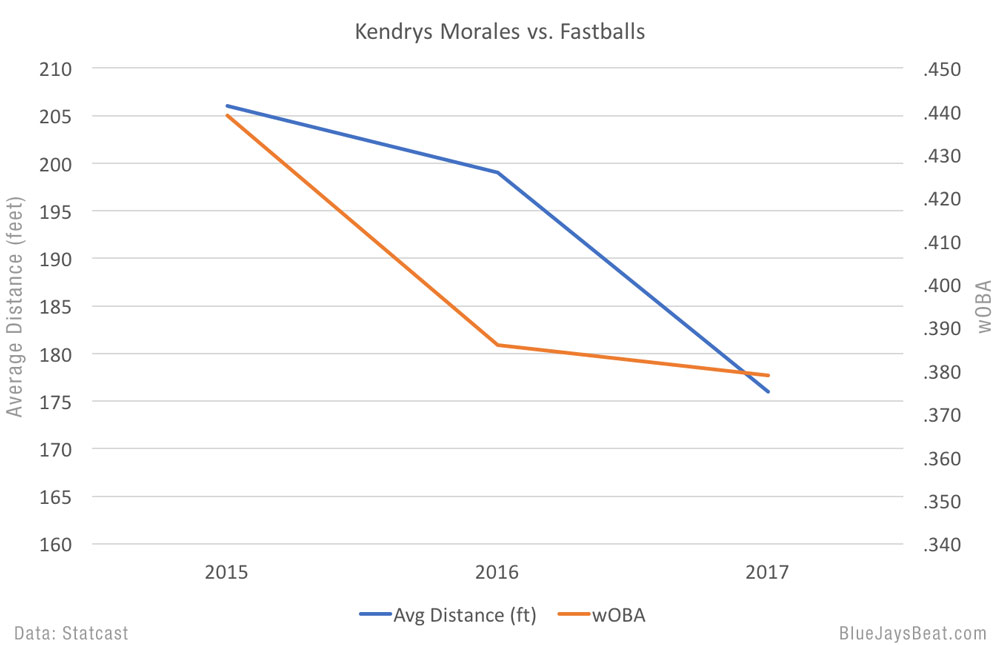
The above data incorporates the 5 different categories of fastballs tracked by Statcast (4-seamer, 2-seamer, cutter, splitter, sinker). The average distance of fastballs he hit last year was 176 feet. That ranked 215th of 405 hitters with a minimum of 50 at bats resulting in a ball in play.
Below are some underlying components of the above results, and one in particular might explain the decrease in average hit distance.
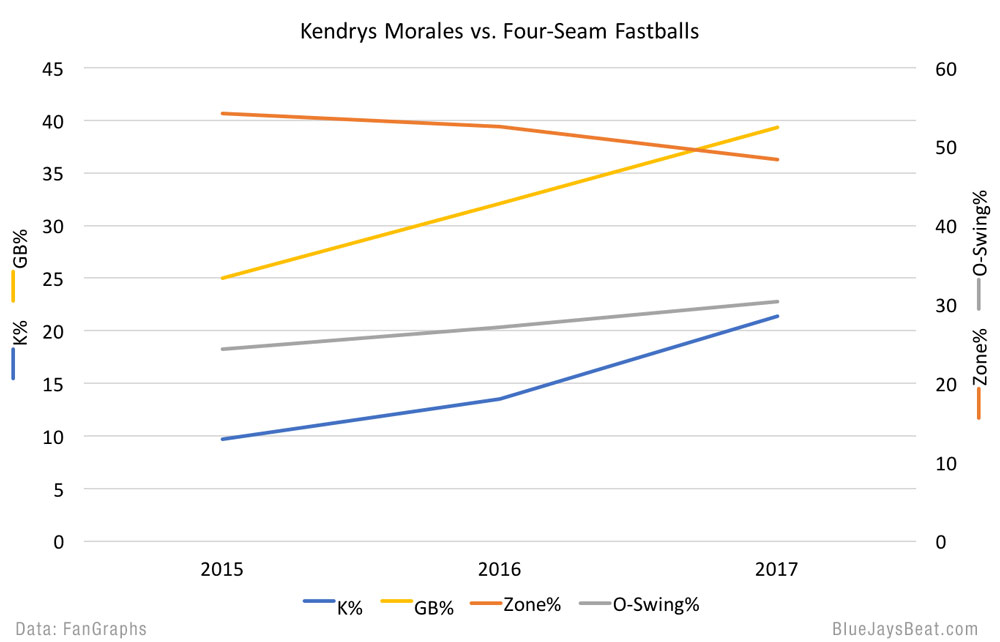
Here we’re looking at Fangraphs data for four-seam fastballs. Fewer pitches have been thrown inside the strike zone to him (Zone%) and he’s been chasing a higher percentage of them (O-Swing%). Subsequently, his strikeout rate (K%) has risen sharply, from 9.7% to 13.5% to 21.4%. And his ground ball rate has gone from 25% in 2015 to 39.3% in 2017.
Balls hit on the ground are not good for Morales. His 3-year batting average of .199 on grounders is well below the league’s 3-year average of .242. He’s not going to run any faster at his age. And as his bat speed decreases he’ll almost certainly need to get the ball in the air more to keep his rate stats from tanking.
This may seem like a jumble of random data points, but a narrative emerges:
- He’s seeing more fastballs off the plate
- Instead of holding up he’s been chasing them
- As a result, the quality of his contact has suffered (hence the increase in grounders and decrease in average distance of hits)
- Contact in general has also suffered (the rising K%)
And if we keep drilling down, namely splits against L/R pitching, we see why this is happening.
As a right-handed hitter facing left-handed pitching, he’s been holding his own the last three years.
| Kendrys Morales vs LHP, 2015-17 | |||
|---|---|---|---|
| Year | BABIP | wOBA | xwOBA |
| 2015 | .340 | .342 | .354 |
| 2016 | .366 | .398 | .401 |
| 2017 | .418 | .428 | .371 |
| Source: Statcast | |||
There’s been some batted ball luck in there, but his xwOBA is in good enough shape against southpaws. Now let’s look at right-handed pitching.
Please excuse my MS Paint-level skills but I’m going to use Statcast’s “Detailed Zones” option and overlay the individual zones I’m isolating pitches for in yellow: everything outside of the strike zone away, and some non-borderline areas above and below the zone.
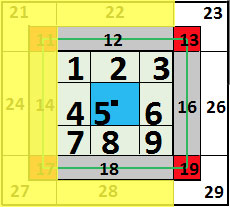
This is from the catcher’s point of view. This is Morales as a left-handed hitter facing right-handed pitchers. And this is just against fastballs.
| Kendrys Morales, Fastballs seen from RHP in selected zones | |
|---|---|
| Year | % of Pitches |
| 2015 | 16.2% |
| 2016 | 19.3% |
| 2017 | 20.4% |
| Source: Statcast | |
Statcast only goes back three years, but it’s far enough to see what appears to be a trend. I don’t know about you, but I have no idea if 20.4% is a lot or a little. I’d like to know where it ranks compared to other left-handed hitters when facing righties, so I looked it up.
Click here for the full list. I set a minimum number of pitches at 500 to try to weed out NL pitchers and part-time players. We’re left with 184 hitters and Morales’ 20.44% is 41st highest, or the 78th percentile rank. So it’s high, but it’s nothing crazy. Eric Sogard saw over 27% of fastballs in the yellow zone last year. Chase Utley saw 25%. Those are the high range outliers. I’m sure if I were to graph these results it would look like a standard bell curve, with most results between 18% and 22%.
But the point is that if pitchers want to exploit this apparent weakness even more, there are clearly examples of rates higher than 20.4% (see the updated section below). This seems like a part of Morales’ approach he’ll need to improve to avoid further erosion of his production. Every hitter has a weakness, and this seems to be the new book on Morales.
Update: March 12th. A visual aid, per Statcast, helps us understand where Morales sits compared to the crowd.
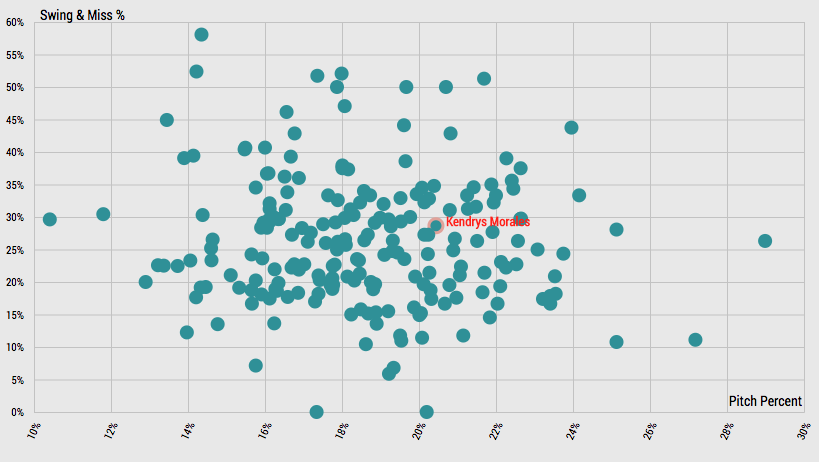
There is a bright side. He’s already had seasons where his ground ball rate (2012) and strikeouts (’09 and ’12) have spiked against right-handed pitchers. To his credit, he made the necessary adjustments and those stats improved the very next season. Maybe he does it again this year. He will be 35 years old however. And his swinging strike rate of 13.3% in 2017 was a career high, so the precedent for correcting that big of a weakness isn’t quite there. But he’ll have the chance to show he can.
It’s unlikely that anyone from the farm system threatens his job security. Rowdy Tellez still has a lot to prove in the minors. And while it’s easy to dream on a Vladimir Guerrero Jr 2nd half call-up to plug him in as DH, chances are we don’t see him until 2019. And manager John Gibbons has a track record of trusting veterans and allowing them to work through slumps. Add it all up, and Morales probably has a pretty long leash in 2018.