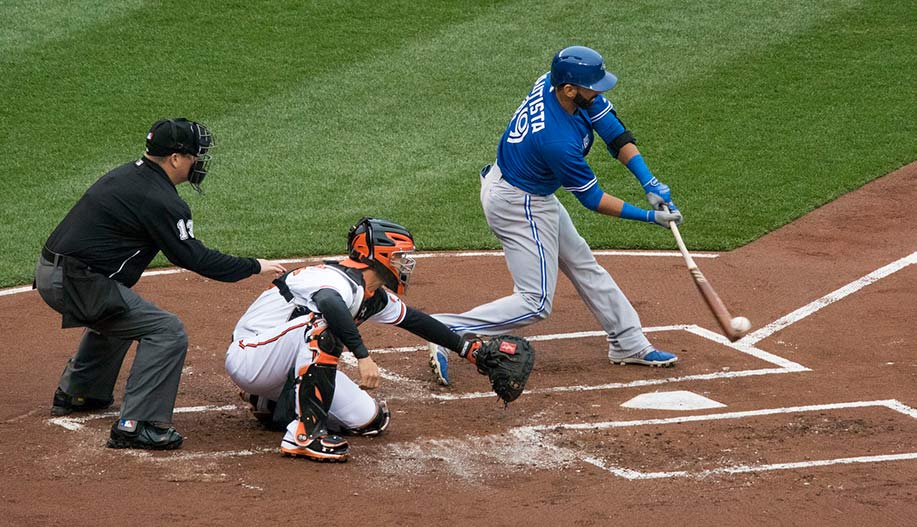
With less than a month left in baseball’s regular season, sample sizes have grown to a point where stats begin to reflect a player’s actual skill level and/or ability. Hot or cold streaks no longer skew the overall batting line to an extreme degree. In other words, there is now a legitimate concern that Jose Bautista might not be a good baseball player anymore.
That isn’t an easy sentence to write, nor is it an easy notion to accept as a fan. Jose is a franchise icon and it won’t be long before his name is rightfully added to the Level of Excellence at the Dome. And that excellence of his is exactly what makes his fall from grace so difficult to comprehend. It wasn’t that long ago that he had that rare combination of huge power and elite plate discipline.
Power numbers usually dry up as a player ages. Bat speed decreases, the swing becomes inconsistent, and fewer balls end up over the wall. Bautista’s isolated power already showed signs of decline in 2016, dropping to a 7 year low of .217. But what’s particularly interesting about his 2017 season is that his eye at the plate is nothing like it used to be. In the span of one year, Jose Bautista’s plate discipline has gone from elite to only slightly above average. What happened exactly?
Check out these 30 game rolling averages via Fangraphs.
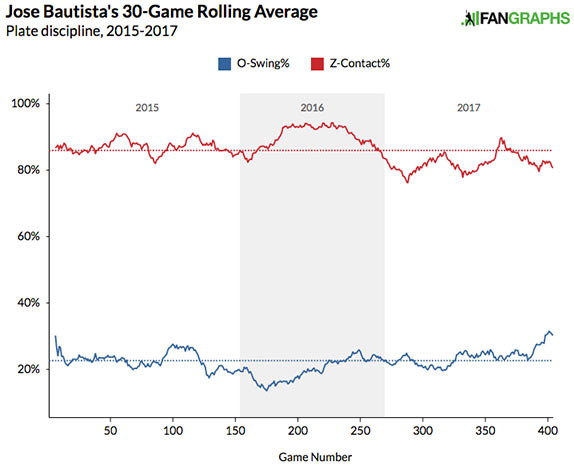
– O-Swing% (blue line) is the percentage of swings at pitches outside of the strike zone
– Z-Contact% (red line) is the percentage of contact made on pitches inside the strike zone
So what are we seeing here? Well, this year Bautista has uncharacteristically had trouble making contact with pitches thrown in the strike zone, pretty much from day one. And as the season has gone on, he’s been chasing more pitches outside of the zone – a rate that just recently hit a 3-year high of 31.5%.
This could be the frustration of a struggling player hitting in the heart of a lineup whose job is to drive in runs. If he can’t, for example, catch up to as many fastballs thrown for strikes, maybe he feels he needs to change his approach in order to put the ball in play.
The problem is that pitchers can exploit this. If they know Bautista is in swing mode they can just throw more balls outside of the zone and wait until he chases.
Now, the overall number of pitches he’s seen in the zone hasn’t actually changed much. Last year it was 42.5% and this year it’s 42.2%. But what has changed is the location where pitchers have attacked him with two strikes, especially right handers.
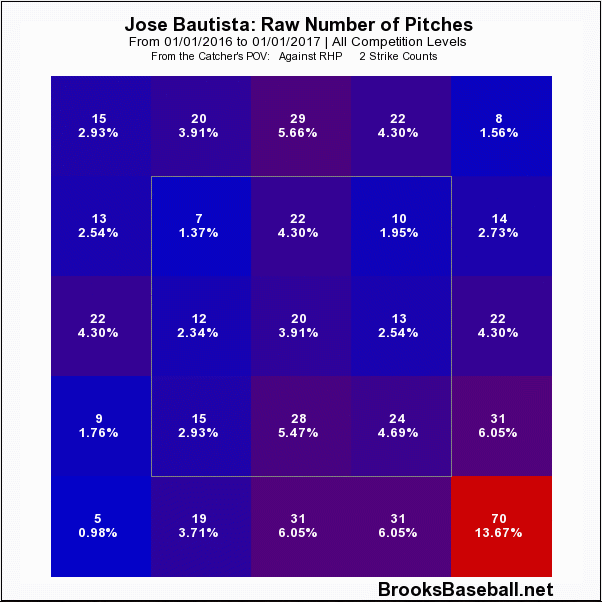
It’s subtle, but you’ll see the purple squares shift. There’s a far more even distribution of pitches in 2016 compared to 2017, where almost 40% of all pitches are localized in the bottom right four squares. Right handers seemingly have a new book on Jose Bautista: Go low and away with two strikes.
This isn’t rocket science. Pitches from righties low and away can look inviting out of the hand but be difficult to do anything with. And if the hitter is known to chase them with two strikes, it’s a hole pitchers are going to exploit. It’s just that this seems like a new vulnerability in Jose Bautista’s game.
Turning to Statcast zone profiles, lets look at their pitch tracking for the 9th and 14th sections of the strike zone, as defined by their zone legend:
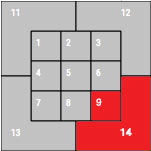
It’s not the exact same breakdown as Brooks Baseball’s zones but it matches up closely enough for our purposes.
Here is Jose Bautista’s wOBA in the last three seasons against pitches in those red zones, in all counts.
2015: .347
2016: .320
2017: .250
And with 2 strikes, his wOBA in 2017 drops to .193 low and away.
It’s been a clear weakness for him this year and pitchers have dutifully exploited it.
With the fastball:
And with the slider:
In fact, Bautista isn’t hitting well with 2 strikes this year in any part of the strike zone. His .222 wOBA is well below the league average of .242 wOBA. And his xwOBA (expected on base average) of .229 isn’t that much better.
One thing that does stand out is his .227 BABIP with a 2-strike count. Often, a low BABIP can signal some bad luck and that positive regression is around the corner. But it can also be deserving if the hitter is making low quality contact. A combination of weak exit velocity and unfavourable launch angles decreases the likelihood that a batted ball goes for a hit.
Let’s use some more Statcast data to see what’s changed from 2016 to 2017 in counts with 2 strikes.
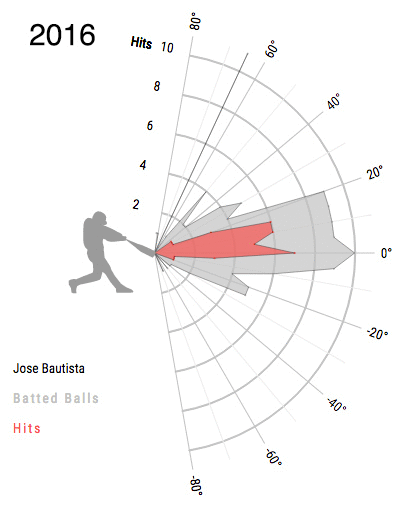
So there is definitely a change in his batted ball profile. Looking at the grey section, he filled up the region between 0 and 20 degrees in 2016. This year his batted balls have mostly come in +/- 5 degrees at the 0 and 20 degree ranges, with a gaping hole between 5 and 15 degrees.
Why is this significant? Consider this graph from Baseball Prospectus that plots batting average on balls in play at all launch angles.
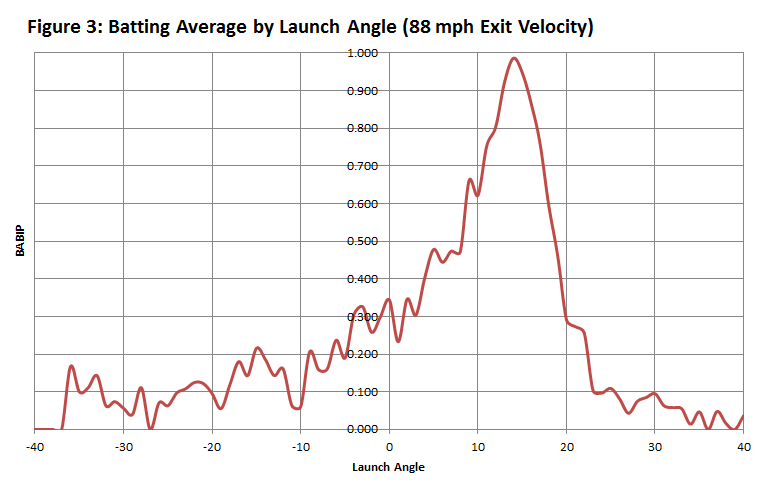
At an exit velocity of 88 mph, that 5-15 degree area is the sweet spot. Balls in play at those angles have a very high likelihood of turning into hits. And Bautista has been putting far fewer of those in play. His exit velocity with 2 strikes isn’t exactly 88 mph – it’s 86.7 – but the point remains. His BABIP isn’t the work of bad luck.
And let’s talk about that exit velo. It was significantly higher in 2016 with 2 strikes.
2016: 91.1 mph
2017: 86.7 mph
Is a drop of 4.4 mph a lot? It turns out it is.
I compared the change in exit velocity from all players with a minimum of 100 plate appearances with 2 strike counts, in each of the last two seasons. There were 177 players who matched that criteria. Only five suffered a loss of 4 mph or more from 2016 to 2017:
| Biggest exit velocity losers, 2016 to 2107 | ||||
|---|---|---|---|---|
| Player | Team | 2016 Exit Velo | 2017 Exit Velo | Velo change (mph) |
| Jose Bautista | Blue Jays | 91.1 | 86.7 | -4.4 |
| Evan Longoria | Rays | 89.8 | 85.3 | -4.5 |
| Mark Trumbo | Orioles | 92.7 | 88.1 | -4.6 |
| Jonathan Lucroy | 3 teams | 88.4 | 83.7 | -4.7 |
| Yasmani Grandal | Dodgers | 92.6 | 87.1 | -5.5 |
That’s not what you want to see from a hitter but perhaps it’s not surprising for one Bautista’s age.
Could Jose’s lack of plate discipline simply be a result of a season-long frustration of not being able to do the job he is expected of? The old “trying to do too much” pitfall might make sense for a player who puts as much pressure on himself as Bautista does.
It’s easier said than done, but it’s possible that Jose Bautista can rebound. If he can reverse the trend of being an easy out with 2 strikes, he can force pitchers to throw more pitches in the zone. He probably won’t ever retain his elite plate discipline but there is room for improvement.
These are the first struggles we’ve ever seen from him with 2 strikes so maybe we should give him the benefit of the doubt and wait to see if he can make an adjustment. It just might not be in a Blue Jays uniform next year and it would be a real shame if this is the way he went out.