Earlier this month, Edwin Encarnacion returned to Toronto for the first time as an opposing player since he emerged as one of the franchise’s greatest all-time power hitters. It was an emotional experience, for both him and the fans. His ex-teammates were chummy before the first game and it was clear that a major part of the Blue Jays’ clubhouse for many years was missed. EE’s return to Toronto also had a sense of finality to it – like the fans needed to see him wearing another jersey to make it all seem real: he was no longer a Blue Jay and would never be coming back.
Getting over an ex can be a challenge. There’s often regret, and wanting a second chance. Or you can lash out, search for blame and generally be an ass. Unfortunately, scorned fans on Twitter took the latter approach over the winter, going as far as trashing Edwin’s “replacement” Kendrys Morales and calling management inept before a single game of the season had even been played.
Anger and frustration naturally comes from being passionate about your team. But if you were one of those fans, you might want to reassess your feelings now that we have a good chunk of baseball to look at.
Let’s dive into the stats.
| Edwin Encarnacion, 2016 vs 2017 | ||||||
|---|---|---|---|---|---|---|
| AVG | OBP | SLG | wOBA | BB/K | AB per HR | |
| 2016 | .263 | .357 | .529 | .373 | 0.63 | 14.3 |
| 2017 | .226 | .346 | .418 | .336 | 0.53 | 17.7 |
The batting average, and especially the slugging percentage, are not where we’re used to seeing them. The power is notably absent. Encarnacion is on pace for his lowest home run total since 2011. And his .336 wOBA would actually be a career low for seasons in which he’s played 100 or more games.
Sometimes a lack of home runs in smaller samples can simply be chalked up to luck. A few deep fly balls to the warning track instead of over the wall can skew things and could easily swing the other way in the coming weeks. Except Edwin’s 24.4% HR/FB rate is actually quite high. It would be a career high, even.
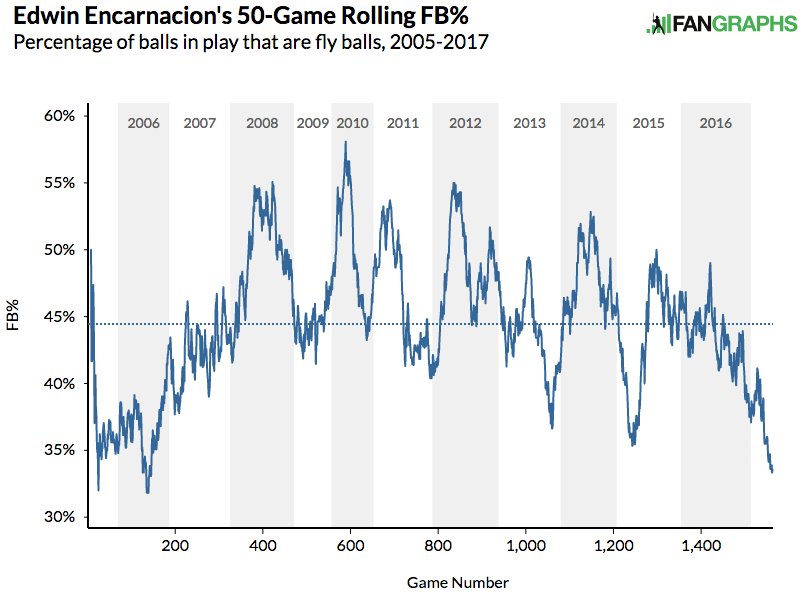
So what that suggests is that he’s simply not hitting as many fly balls. And sure enough…
| Edwin Encarnacion, Batted Ball Profile | |||||
|---|---|---|---|---|---|
| GB/FB | LD% | GB% | FB% | IFFB% | |
| 2017 | 1.20 | 25.6% | 40.5% | 33.9% | 9.8% |
| Career | 0.82 | 19.2% | 36.4% | 44.5% | 14.6% |
More balls on the ground, fewer in the air. And to a notable extent. Over 50 game stretches, Encarnacion hasn’t had a fly ball rate this low in the past decade.
Statcast data.
Encarnacion has always been a slow starter. April has historically been the worst of any month. But we’re moving into June and things still aren’t where they should be.
In 2016’s first two months, Encarnacion had an average exit velocity of 97.1 mph on balls hit with launch angles between 21 and 36 degrees*. His counting stats might have been lacking, but the advanced data suggested not much had changed. This season his average exit velocity on 21-36 degree balls in play is just 92.9 mph.
*note: Most home runs occur from hits in that 15 degree bucket. For further reading, click here and scroll to Method.
Over 4 mph is a pretty big drop. To add some context, Encarnacion’s exit velocity for the entire 2016 season on 21-36 degree balls in play was 96.8 mph which ranked 5th in the majors (min. 50 batted ball events). It goes without saying that we’re used to seeing Edwin consistently hit baseballs hard whether they’re going for extra bases or not.
Of course, the sample size we’re using for 2017 is probably too small to draw conclusions from. Encarnacion has hit 24 balls between 21 and 36 degrees which, intuitively, doesn’t feel like a lot.
Now for some plate discipline stats.
His walk rate is up – from 12.4% in 2016 to 14.2% in 2017. That’s good.
His strikeout rate is also up – from 19.7% in 2016 to 26.9% in 2017. That’s bad. It’s even worse when you compare it to his career K% of 16.5%. That’s ten percentage points worse. Yikes.
His 11.6% swinging strike rate on all pitches is a career high, 3.1% higher than his career average. Another concerning spike.
Comparing the current stretch of contact issues to the past five years reveals a bit of a concern.
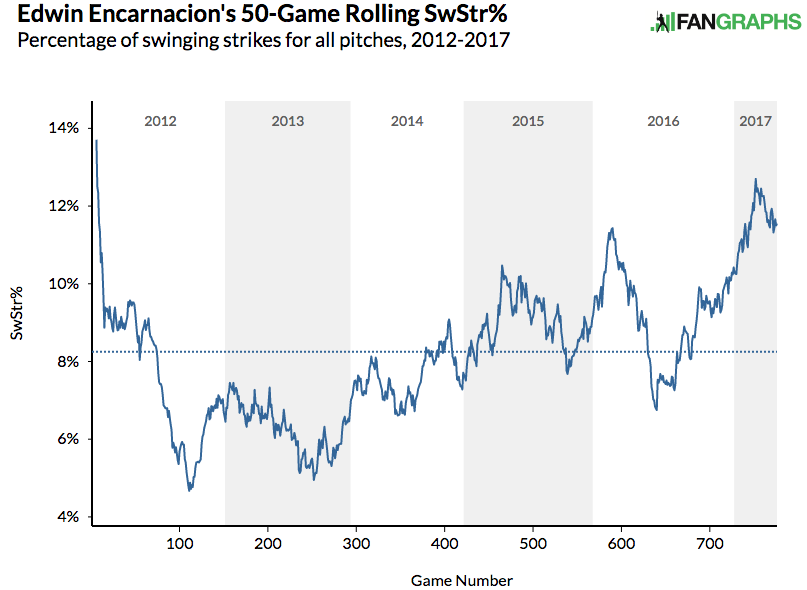
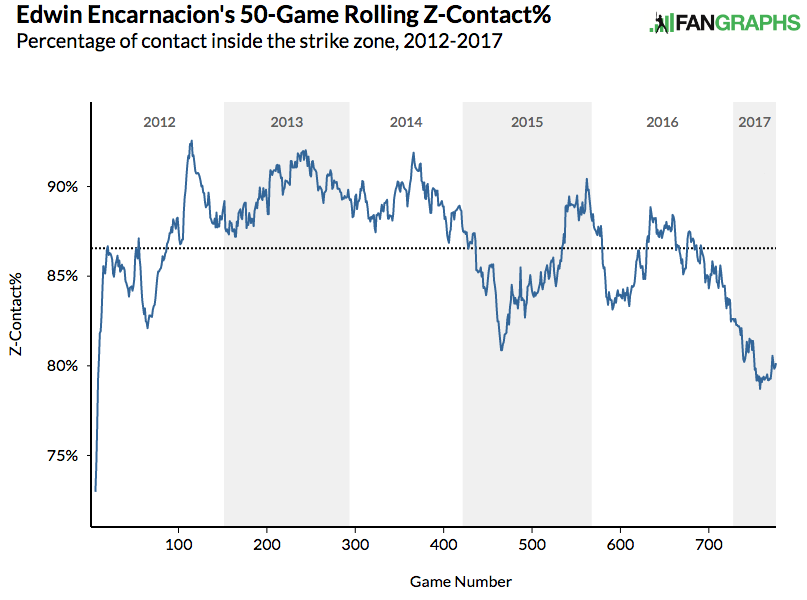
His rate of contact on pitches in the strike zone and his swinging strike rate across 50 game stretches are all unprecedented. In other words, this is the worst 50 game stretch he’s had since his breakout season.
Moving forward.
Given the above factors, it’s no surprise why Encarnacion’s traditional numbers are not up to snuff. He’s making less contact on balls he can drive and the ones he is putting in the air are coming off the bat at a slower speed. The ones he’s hitting harder are at a lower angle and less likely to do damage. It’s far too early to tell if age is catching up to EE but those graphs show a trend dating back earlier than just 2016/2017.
All this doesn’t mean Edwin can’t improve. And it doesn’t mean that the three year deal he signed with the Indians won’t ultimately provide good value to the team. But we’re seeing some very non-Edwin like signs right now that he’ll have to correct. As always, it’ll be interesting to monitor these trends as the season progresses.