While browsing Fangraphs’ Pitch Value leaderboards recently, I was surprised to see four Blue Jays starting pitchers rank in the top 21 for Curveball Value in 2016.
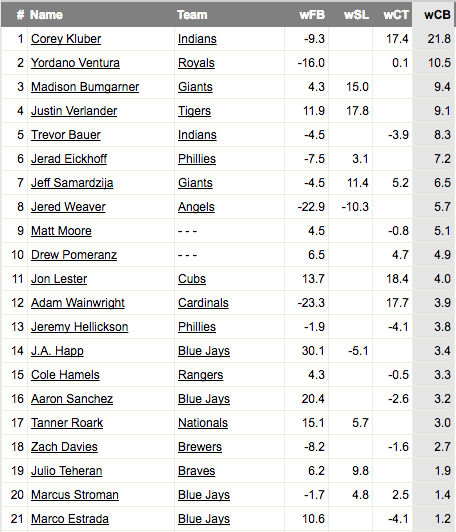
This came as a bit of a surprise, as I hadn’t thought of the pitching staff as being very curveball-reliant. As it turns out, they aren’t. But when they did throw the curve, it was a highly effective pitch.
Before breaking down the individual pitchers, here is a primer on the Pitch Value metric:
http://www.fangraphs.com/library/offense/pitch-type-linear-weights/
If you’d rather skip that article in favour of a quick grasp of the stat, it goes something like this:
Every time the count to a batter changes, run expectancy changes too. Throwing a ball to create a 1-0 count results in a run expectancy change of -0.04 for the pitcher and +0.04 for the hitter. Every pitch result has a value associated with it, either positive or negative for the pitcher. These tiny values are also assigned to the type of pitch thrown and are added up to form a total value for each pitch using linear weights. (which is where the tiny ‘w’ comes in as part of the stat)
So a pitcher doesn’t have to use his curveball very often to accumulate a positive wCB value if it primarily results in strikes and outs. Conversely, a pitcher’s curveball doesn’t have to be a devastating hammer as long as he uses it often and it doesn’t suck.
Aaron Sanchez
Sanchez’s curve always flashed plus but his challenge was commanding it. Last season his confidence in the pitch surged and he used it frequently with men on base (having a great blocker in Russell Martin surely helped), in full counts, and even sometimes throwing it twice in a row to the same hitter. As a kid who seemed destined for a relief role at times, it became a weapon as hitters managed just a .175 batting average against it while striking out 28.3% of the time. The average exit velocity of the ball off curveballs thrown was 85.3 MPH, well below the league average of 87.2 in 2016.
Here he uses it in a full count, two out situation to Evan Longoria. Buck Martinez knew what was coming:
And even when he left the pitch up, he was still able to get outs:
In Sanchez we trust.
JA Happ
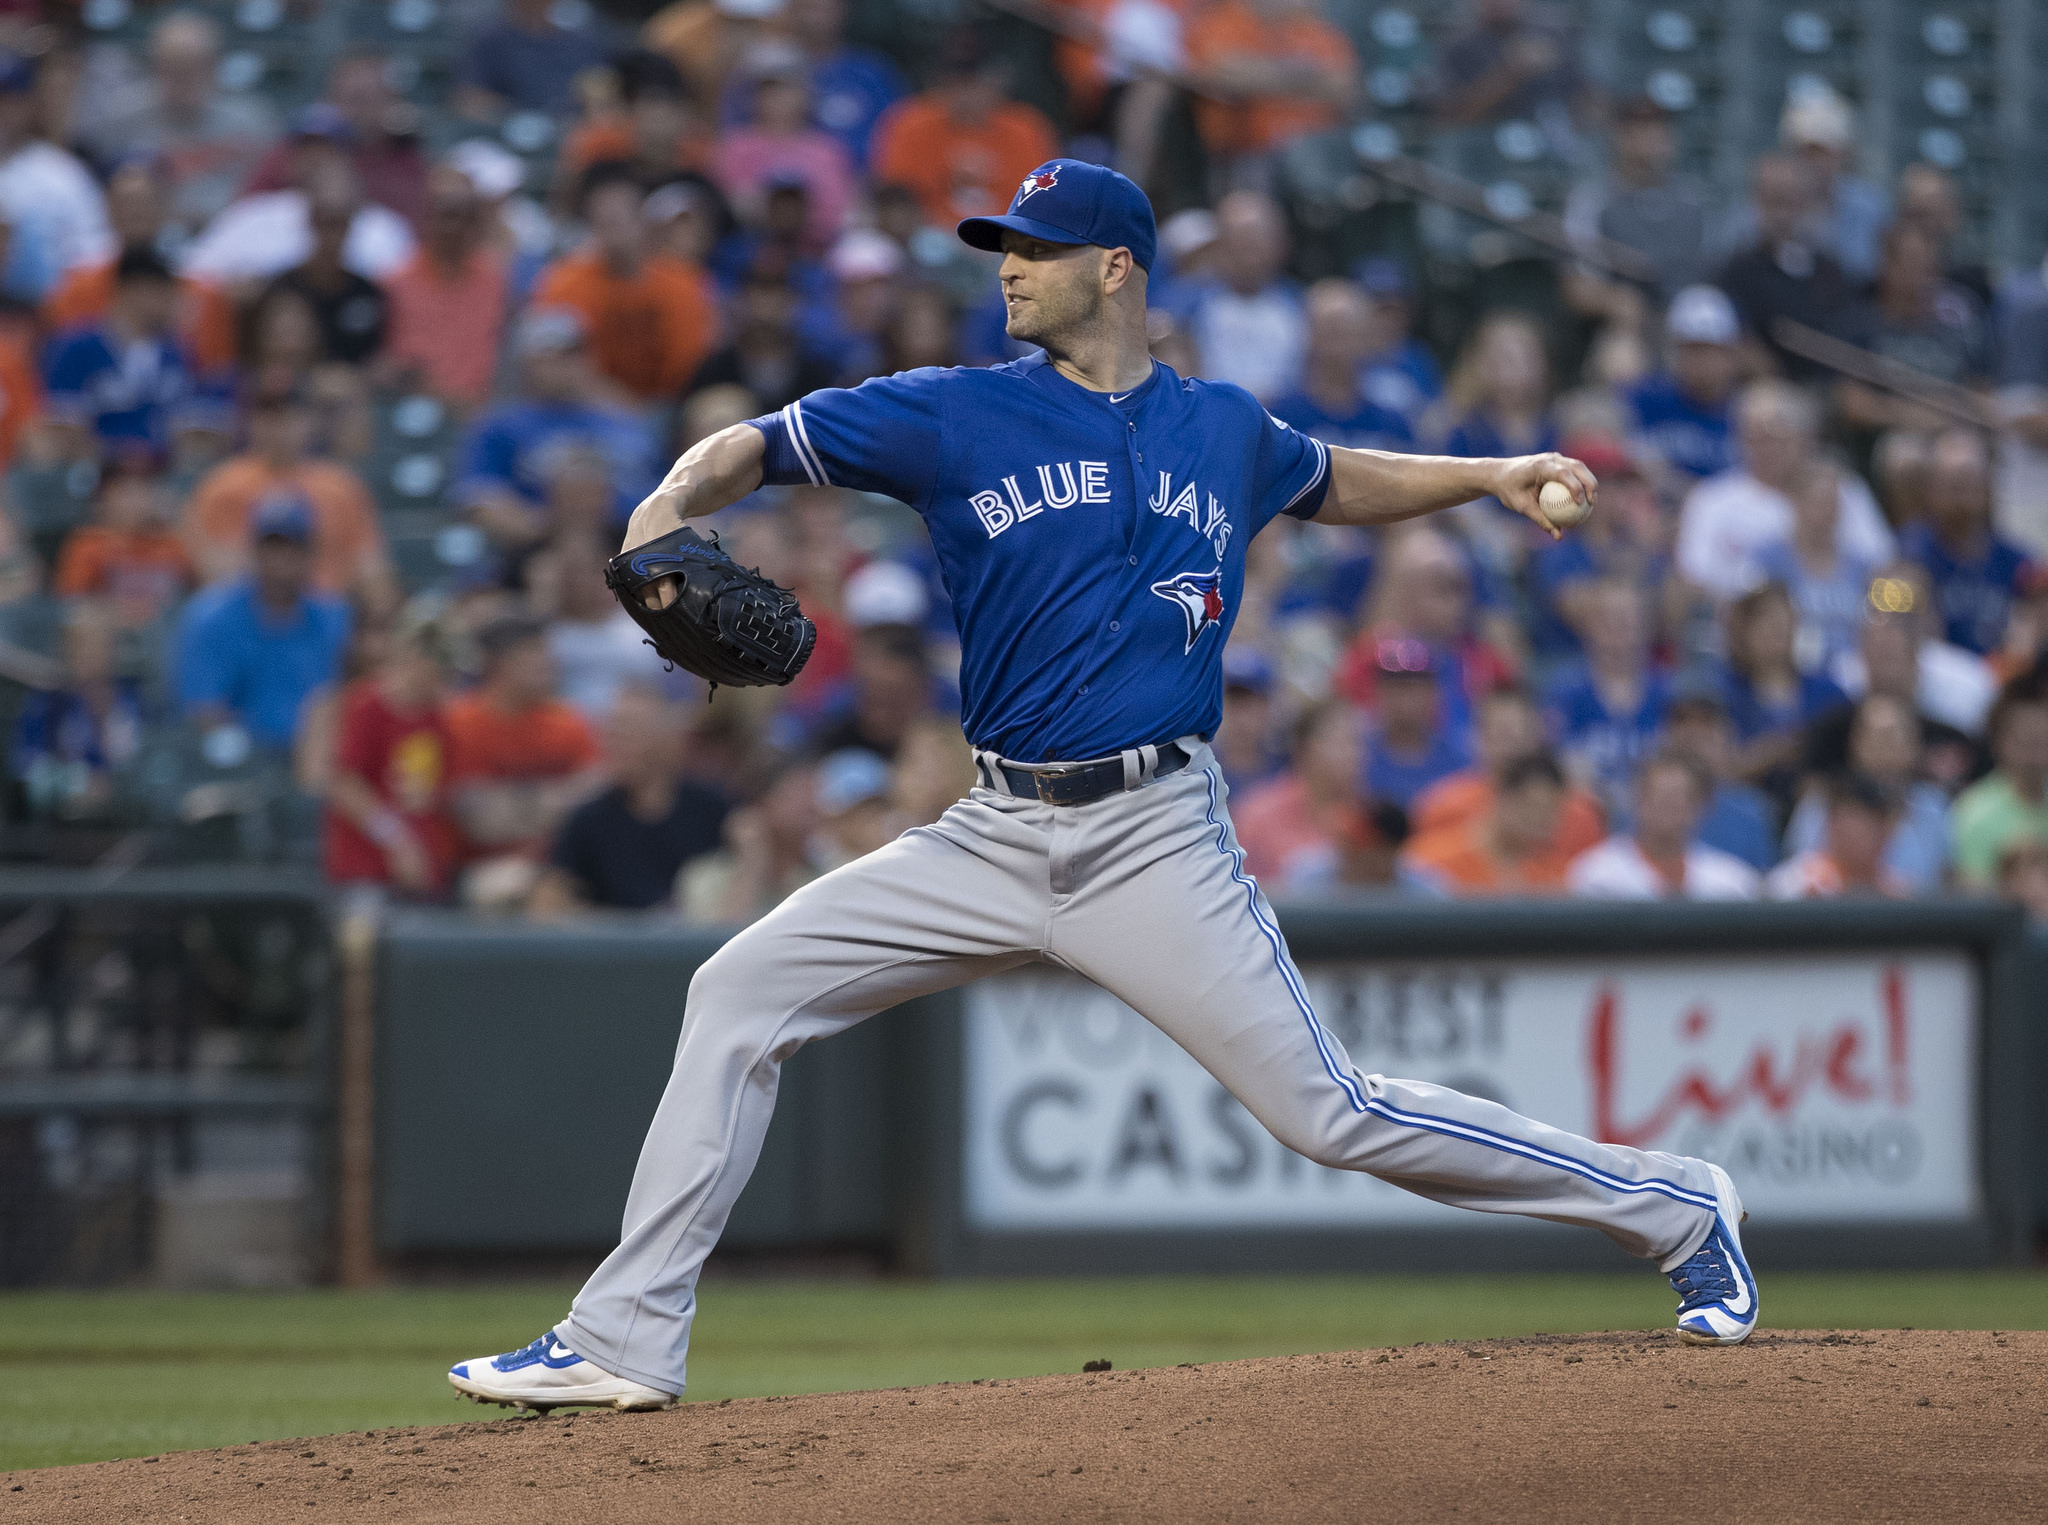
JA Happ transformed himself as a pitcher in 2015, going from a run-of-the-mill 5th starter with an ERA well over 4 to a fastball-reliant #3 starter who has put up back-to-back seasons of 3+ WAR. He even finished 2016 with the 6th most AL Cy Young votes.
We’re talking curveball though, and Happ’s dominance has largely rested on his use of the fastball. In fact, he used his curve only 7.5% of the time in 2016, its lowest rate since 2010. But in doing so, he may have improved its effectiveness.
Batters hit only .137 against it, by far a career low for Happ. His contact and swinging strike rates against the curveball didn’t change much in 2016. But over the last two years it’s been more of a harder curve. Its average velocity in 2009 was 73.5 MPH. In 2016 it was 78.5. There’s been less movement on it as well, which makes sense as a harder thrown pitch. It would appear that he’s consciously changed how he uses it. With Happ, it seems the “less is more” approach has paid off given the increased velocity and effectiveness of his fastball.
Marco Estrada
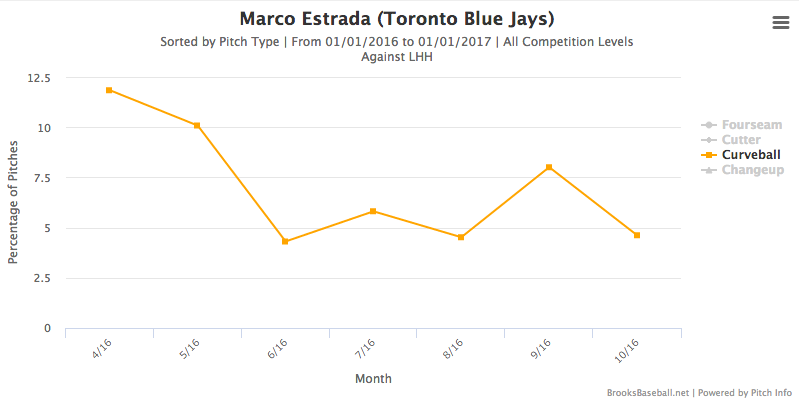
It wasn’t all positive for the staff and the curveball though. Marco Estrada decreased his usage of the curve mid-season, particularly against left handed hitters.
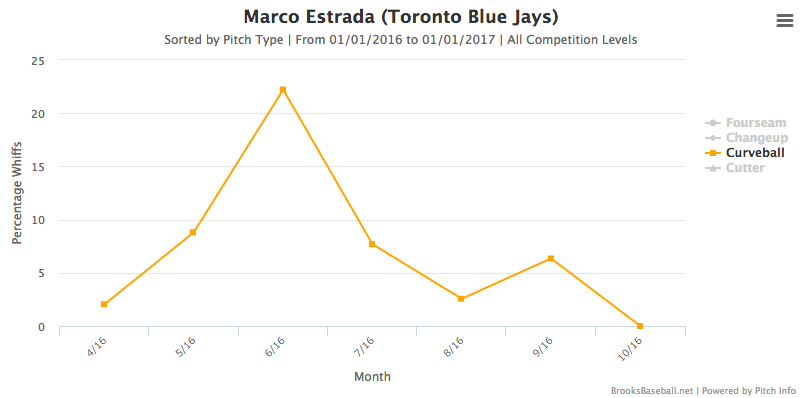
It was reported in mid-September that he was pitching through a herniated disc. Being a feel pitch, it’s possible Estrada consciously scrapped it due to his struggles physically. As we can see, its Whiff Percentage dropped significantly as the 2nd half began:
That said, it was still an effective 4th offering, resulting in a 55.7% ground ball rate for the year. As an extreme fly-ball pitcher, this is a notable exception for Estrada. Below is a heat map of where his curveballs to left-handed hitters ended up in 2016:
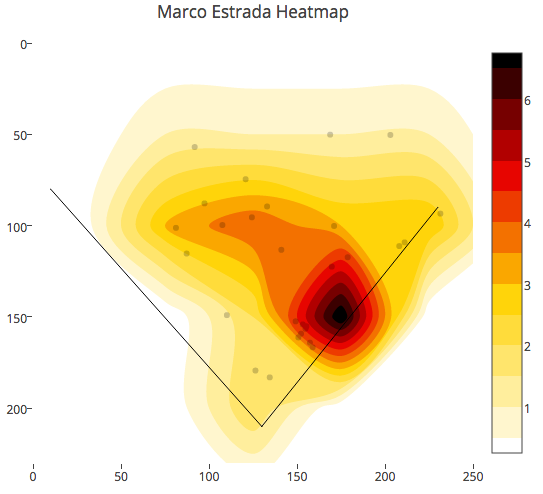
On first glance it looks pretty good. Nice and predictable on the right side of the infield. But compare it to his results in 2015:
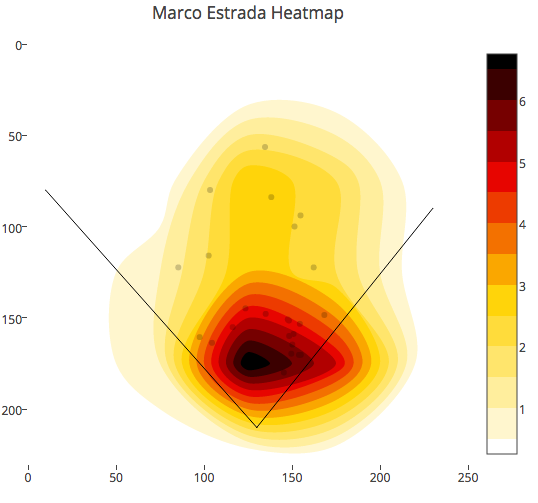
Yeah, that looks way better. These results indicate he was able to induce even softer contact in 2015. This is further supported by hitters’ wOBA against the curve in 2015 (.231) compared to 2016 (.276).
Despite the curveball still being an above average pitch in 2016, there’s room for improvement.
Marco is the type of pitcher who lives off deception and spin rate in order to induce soft contact and pop ups. When he’s on, he’s highly effective and incredibly frustrating for hitters. When one thing is a little off, he’s prone to giving up harder contact and resembles more of a back-of-the-rotation starter. The thing that was a “little off” in 2016 was his back.
It’ll be interesting to see if he continues to rely mostly on his four-seam fastball and changeup in 2017, or if he decides to incorporate the cutter or curveball more. In my mind, the cutter would make sense to righties as it would dive in on their hands, while the curveball could be a weapon to get lefties to chase down and in. Ultimately, good health is the most important thing for Estrada in 2017.
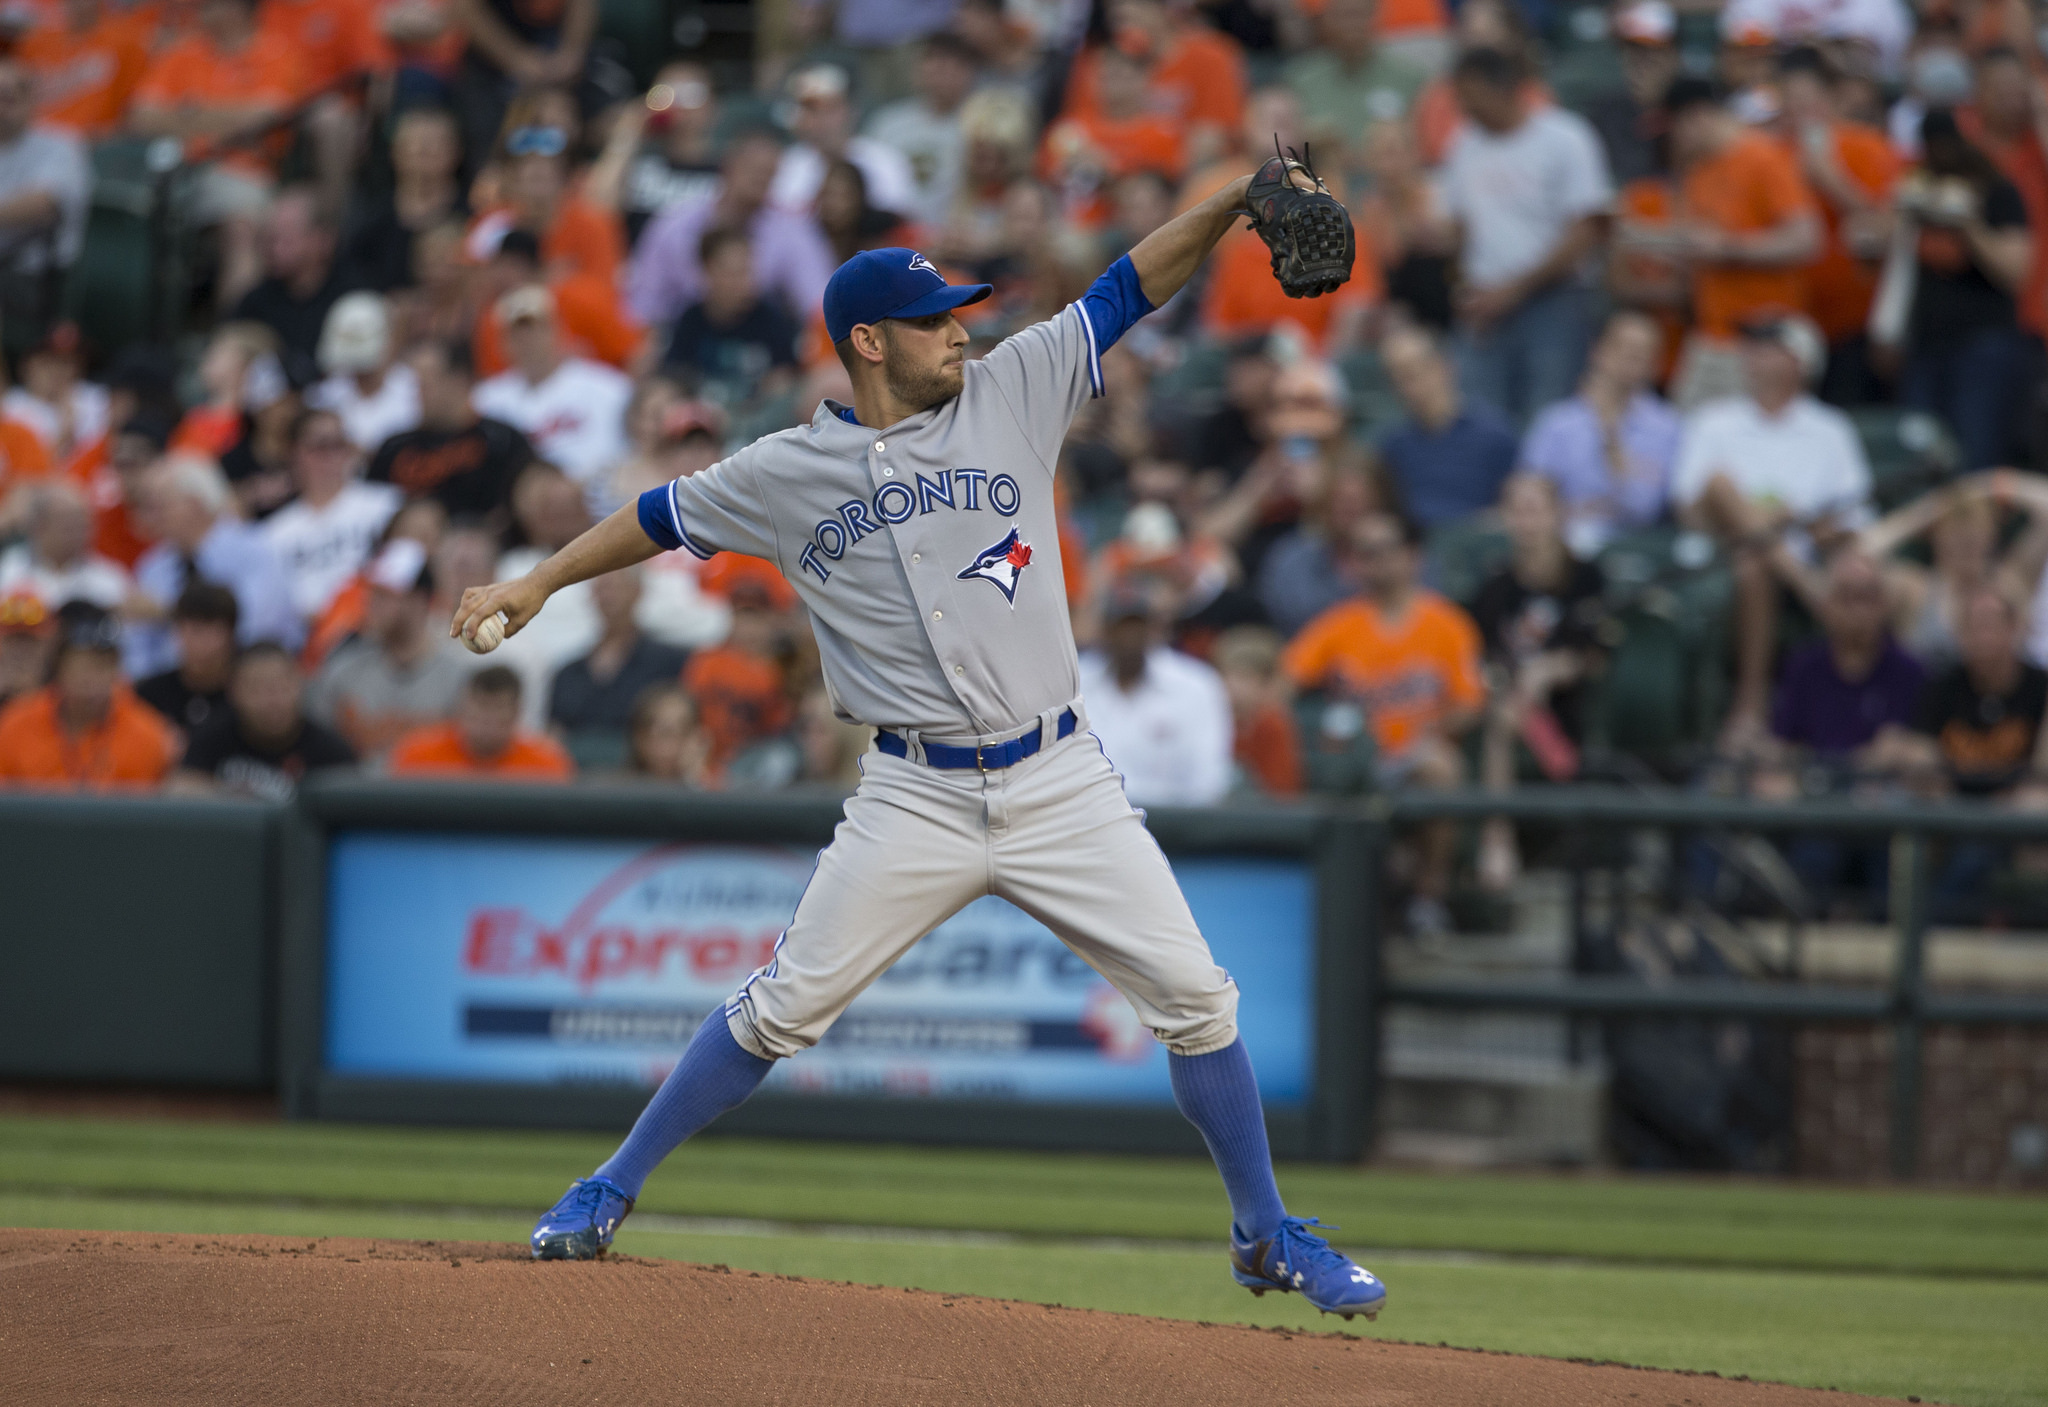
Marcus Stroman
For such a vast repertoire of pitches, one cannot be criticized for failing to notice Stroman’s curve. His sinker is the obvious weapon – two years ago Jeff Sullivan of Fangraphs called it Roy Halladay’s sinker which is obviously high praise – and in 2016 it accounted for 47.6% of his pitches. His slider also took a big leap forward last season. In 2015 hitters had a .729 OPS against the slider – in 2016 that fell to .578.
But his lowest OPS on any pitch was .568 against, you guessed it, the curveball. While he only thew it 10.2% of the time, he used it against both lefties and righties equally. Lefties had the most trouble with the curve, hitting just .147 against it.
Stroman is still a work in progress. In 2016 he even introduced a “quick pitch” windup in order to mess up the hitter’s timing. It didn’t always work out. Even if he scraps it (and this author thinks he should) his developing arsenal of 6 pitches is more than enough to get him by. He’s a 2017 breakout candidate if there ever was one. Perhaps the curveball will feature more prominently? We’ll have to wait and see.
It’s clear the Jays have a wide range of pitching styles in their rotation but one thing remained a constant in 2016 – while some pitchers used it more than others, the curveball was an effective offering. This obviously doesn’t happen without having solid primary pitches at their disposal. Estrada’s fastball-changeup combo is tough enough on its own – throw a slow, arching curve in there every now and then and it can get some funny swings. Sanchez’s terrific heater is his bread and butter and if he can start the curve at the hitter’s eye and have it end up just out of the zone, he’s going to be able to keep hitters off balance.
While there probably won’t be many articles written about the curveball and the Blue Jays pitching staff, it still seemed worth pointing out. And if Joe Biagini is stretched out as a starter we could have one more reason to focus on the pitch.